Variance with a cause
Every variance opens to the transactions behind it, so the cause is found.

Budgets, forecasts, scenarios, drivers and variance analysis.
Book a Demo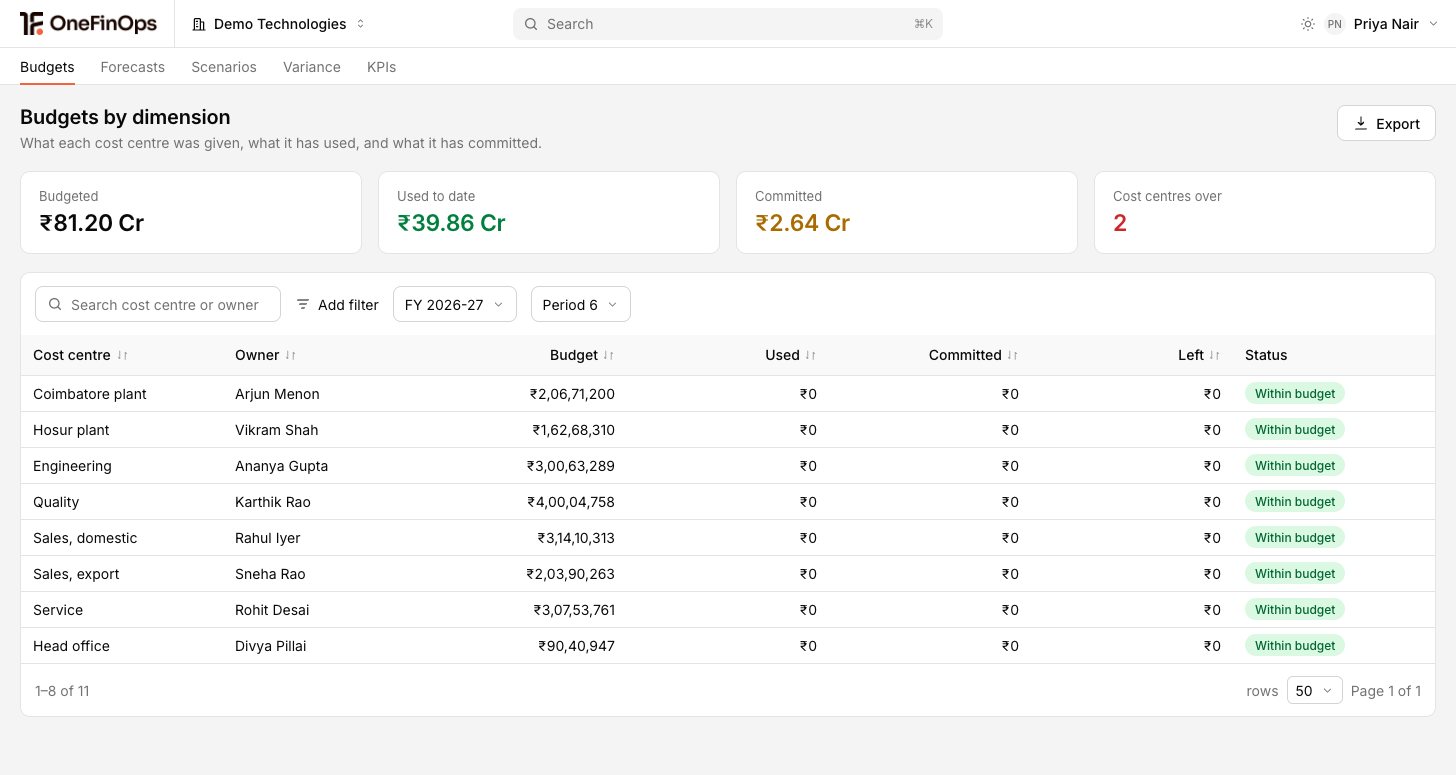
FP&A is the working surface for the finance team that owns the numbers.
Every variance opens to the transactions behind it, so the cause is found.
Salaries$1,322,700
Payroll tax$198,400
Travel$102,400
Lines edited0
One driver changed, 42 lines followedVolume, price, rate and headcount drive the model. Change one, it flows.
Account6120
EntityUS
PeriodEach
The explanation is stored against the number and is there next quarter.
| Line | Ledger | Analysis | Result |
|---|---|---|---|
| Revenue | $4,164,700 | $4,164,700 | Match |
| Cost of sales | $2,410,000 | $2,410,000 | Match |
| Travel | $134,000 | $134,000 | Match |
The actuals in the analysis are the postings, so there is nothing to tie out.
Pick a capability to see what it does. Each one opens to a page of its own.
Build, review and lock the budget by dimension.
Explore BudgetsOperating$48,200,000
Headcount412
Capital$3,600,000
Versionsv1 · v2 · v3
A forecast that re-bases itself as the year progresses.
Explore Rolling ForecastsDownside, base and upside on the same structure.
Explore Scenarios| Covenant | Cash floor | EBITDA | |
|---|---|---|---|
| Downside | |||
| Base | |||
| Upside | |||
| Price +3% |
HoldsNot testedBreaks
The relationships that actually move the numbers.
Explore Driver Models DriverValueEffect
Revenue$48.2M
Volume · units1.2M$46.1M
Price · average$38+$2.6M
Mix · GB-40 share31%+$1.1M
Churn4%−$1.6M
The gap, decomposed, with the transactions underneath.
Explore Variance AnalysisHeadcount, cost and capacity planned as one thing.
Explore Workforce PlanningTargets defined on the ledger, so the actual needs no assembling.
Explore KPI TargetsKPI-12Last 12 monthsBring your drivers and a plan. We land actuals against it as they post.